Showing posts with label #FOREX #STRATEGY. Show all posts

Sunday, 30 May 2021

Ultimate Oscillator


Buying Pressure (BP) = Current Close – Minimum (Current Low or Previous Close)


Ultimate Oscillator = 100 x [(4 x Cycle1) + (2 x Cycle2) + Cycle3] / (4 + 2 + 1)


Calculation

If:

·         Cycle 1=7

·         Cycle 2=14

·         Cycle 3=28

Then:

Ultimate Oscillator = 100 x [(4 x Average7) + (2 x Average14) + Average28] / (4 + 2 + 1)


Overbought and oversold signals:

In an uptrend:

Buy when the indicator rise above oversold line.

In a downtrend:

Sell when the indicator falls below the overbought line.

Divergence signals:

Buy signal normally at the end of a downtrend: Wait for the bullish divergence in the market. This means, the price should make a lower low, but the indicator should display a higher low.

Sell signal normally at the end of an uptrend: Wait for the bearish divergence. This means, the price should make a higher high, but the indicator should display a lower high.
Sunday, 2 May 2021

Time Series Forecast Indicator (TSF)


 The Time Series Forecast tries to calculate a best-fit line over a specified time period using Linear Regression. This line is then plotted forward for a user-defined time period.


I use this in an identical way as I use 2 moving average indicators.
So the same setups will be used here. You can watch the video for how to use moving averages here .

The advantages of using TSFs over MAs are:
  1. Moving average has more delays.
  2. TFS also tries to forecast the price.

Sunday, 25 April 2021

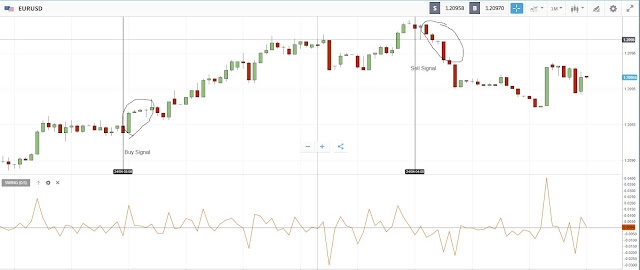
Swing Index Indicator (SI)

  1. Swing Index is used to compare a price movement to price swing 
  2. The purpose is to defining the strength of price movement.
  3. Positive SI reading can be a sign of a price up-move and negative SI readings considered as a sign of price down-move. 
  4. Swing Index is based on the 2-bar data
  5. I prefer to use SI on shorter time frames as it is only reliable to predict just several bars into the future. 
Signals:

  • Buy signal: when the Swing Index crosses over zero. (Duration of trade only next few candles)
  • Sell signal: when the Swing Index crosses below zero. ( Stay in trade or change SL after only a few candles)


Sunday, 11 April 2021

Stochastic Momentum Index (SMI)

We can use this indicator to get the following information.
Overbought or Oversold: Above the overbought and below the oversold lines.
Trend: More oversold in compare to overbought indicates a downtrend.
More overbought in compare to oversold areas indicates a downtrend.
Trading Signals: Crossing the lines inside the extreme areas.

Monday, 25 January 2021

Pretty Good Oscillator Indicator

In a Downtrend: Only sell 1. At the end of the overbought area 2. Add when crossing below 0 line 3. Add at the start of Oversold In an Uptrend: Only buy 1. At the end of the oversold area 2. Add when crossing above 0 line 3. Add at the start of overbought Indicator Settings Period 28 Overbought 2 Oversold -2 Your Capital is at Risk. This is only an educational video.

Sunday, 15 November 2020

Tuesday, 27 October 2020

Lowest Low Value


The Lowest Low-Value indicator plots the lowest low price over a specific period. 
Previously on my other video called "Highest High-Value Indicator (HHV)" I explained how we can combine HHV with MA. (Link is provided below)
On this video, I am explaining how to use both LLV and HHV indicators combined with ATR to confirm trading signals.
HHV and LLV are very reliable in the trendy market, so it is wise to only use them when we have high ATR readings.

Wednesday, 19 August 2020

High Minus Low indicator (HML)

 Recognise the volatile market.

Figure out the trend direction.

Open your new positions.


HML indicator simply plots the difference between high and low.

High readings mean we are in a trendy market.

Low readings mean we are moving sideways in a range.

My strategy:

✔Combine this with a volume indicator (Like Accumulation/Distribution Indicator)

✔High reading HML and increasing volume mean we are in an uptrend.

✔High reading HML and decreasing volume mean we are in a downtrend.

For the link to the video, please click here!


Wednesday, 29 May 2019

Mental and Physical training for Forex traders

If you are a Forex trader, you probably made some choices that you regretted after. You can probably think of many examples when your thoughts or your emotions got in the way of your trading performance.

Imagine these situations:

  1. You closed a position in loss and the price direction changed after.
  2. You see a movement in price and open a position in a hurry which ends up losing a lot of money.
  3. Closed a position in a little bit of profit, despite the fact that your analysis predicts more profit.
  4. In case of copying other people, you stopped copying after a few losses and then that trader started making more profit.
And many other times that your emotions cost you a lot of money.

 If you want to increase your stress capacity, Mental training increases your trading performance potential. And like many other skills, you can be perfect by practising it.

Goals in mental training:
  • Eliminate doubts and worries that might get you out early from a trade or lead you to move your stop loss when you do not need to.
  • Increase your stress capacity.
  • Healthier life.
  • Increase in concentration.
  • Manage your feelings pre, during and after trading.
To manage feelings of fear, anxiety and stress in regards to achieving the above-mentioned goals we can do the following exercises:

  • Regulate your breathing. You can even download apps at the beginning to help your breathing techniques.
  • Add Yoga to your daily routine.
  • Schedule your trading hours and include some rest times.
  • Give yourself some days off. Or simply do not think about trading during the weekends.
  • Go to holidays to refresh your mind.
  • Prepare a trading strategy and only follow that.